Breaking Quarantine

After 14 days of quarantine, it’s time to get some!

Jocelyn and I have been extremely careful during the COVID-19 crisis. We have three young kids and do NOT want to get sick!

Beginning mid-March we barely left our yard. In today’s age virtually anything can be delivered, so there was little need to go out. With me working from home and the kids taking classes online there was little need to leave the house. Sure, we would go on afternoon walks (with masks on), or play in the yard – but there was little venturing out. Live contact with other humans was virtually nonexistent.

So when it came time to head up to Maine we didn’t think twice about the two-week quarantine we’d have to do when we got here. Two weeks – that’s nothin’!

Continue reading “Breaking Quarantine”
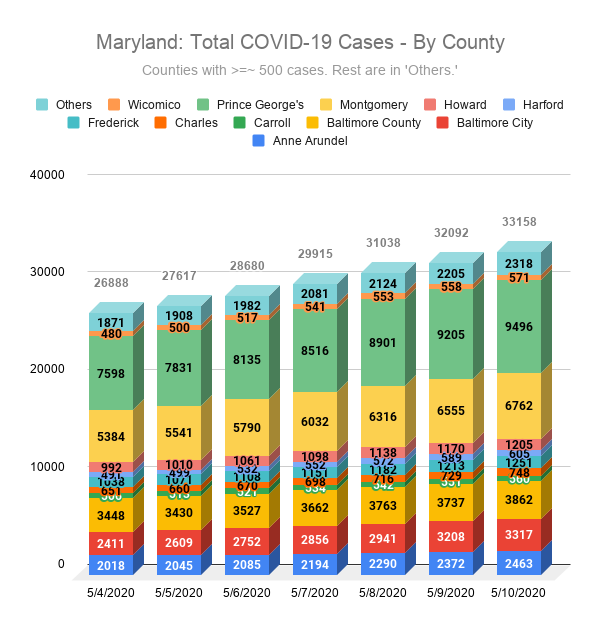
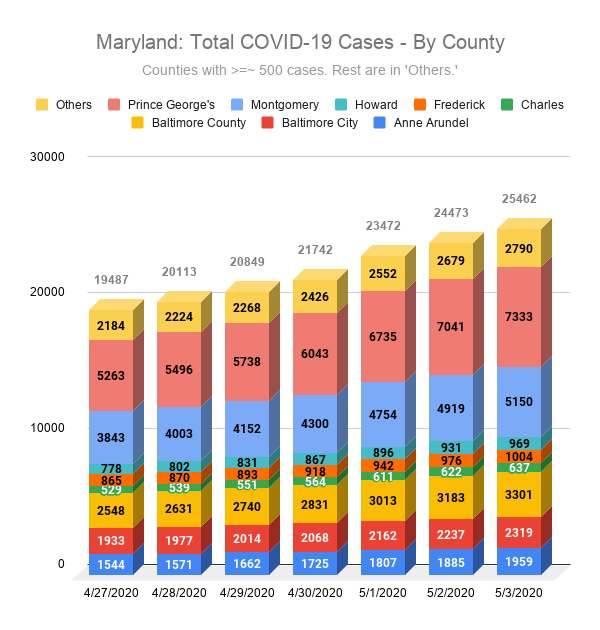
COVID-19 – Charts: April 27-May 3, 2020

COVID-19 charts from April 27-May 3, 2020

Below are charts from April 27 to May 3, 2020. See charts from the current week.


Maryland Cases by County

To keep these charts clean, I established a threshold of 250 confirmed cases to be separately listed in this chart.

Maryland: Total COVID-19 Cases - By County
Maryland: Total COVID-19 Cases – By County
Continue reading “COVID-19 – Charts: April 27-May 3, 2020”

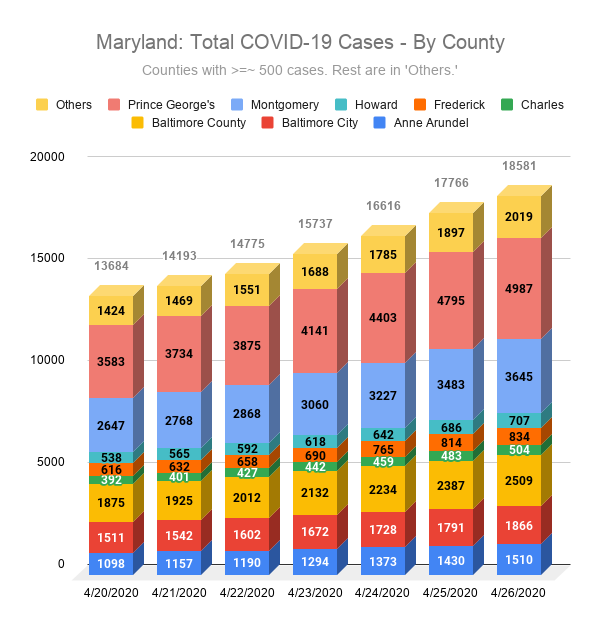
COVID-19 – Charts: April 20-26, 2020

COVID-19 charts from April 20-April 26, 2020

Below are charts from April 20 to April 26, 2020. See charts from the current week.


Maryland Cases by County

To keep these charts clean, I established a threshold of 250 confirmed cases to be separately listed in this chart.

Maryland: Total COVID-19 Cases - By County
Maryland: Total COVID-19 Cases – By County
Continue reading “COVID-19 – Charts: April 20-26, 2020”

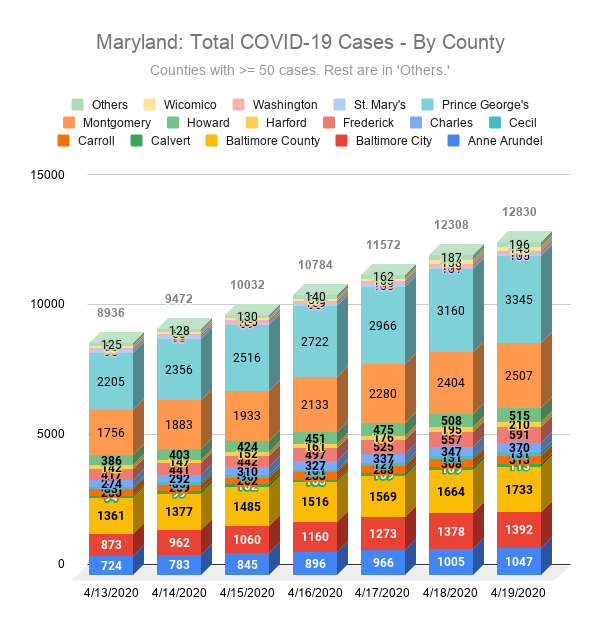
COVID-19 – Charts: April 13-19, 2020

COVID-19 charts from April 13-April 19, 2020

Below are charts from April 13 to April 19, 2020. See charts from the current week.


Maryland Cases by County

To keep these charts clean, I established a threshold of 50 confirmed cases to be separately listed in this chart.

Maryland: Total COVID-19 Cases - By County
Maryland: Total COVID-19 Cases – By County
Continue reading “COVID-19 – Charts: April 13-19, 2020”

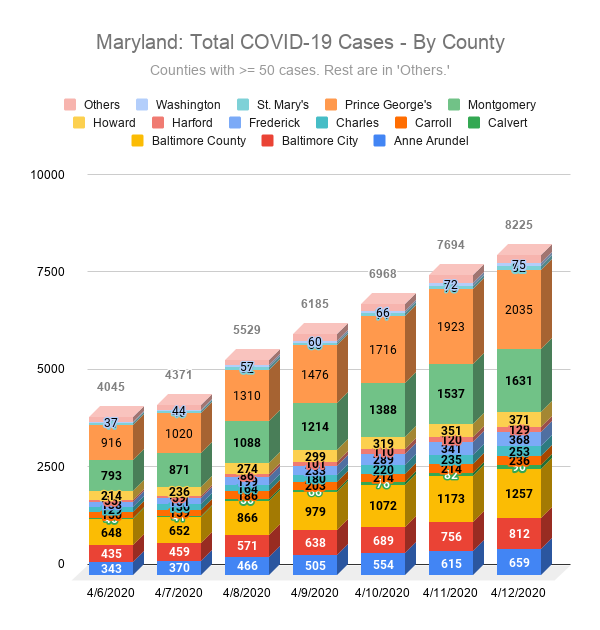
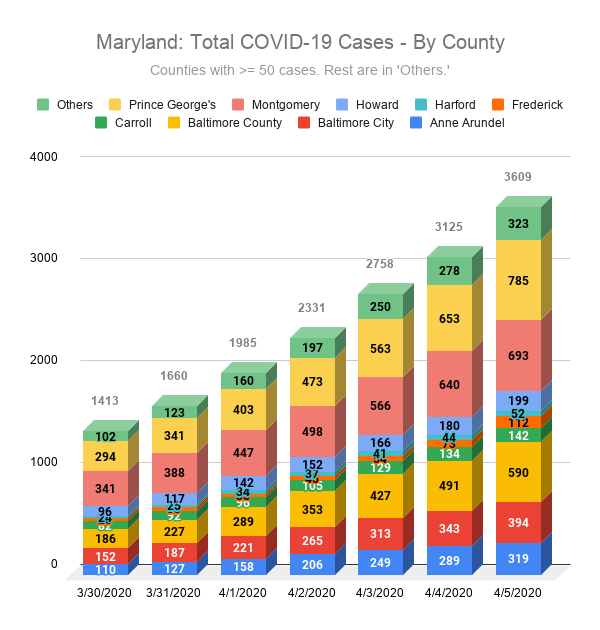
COVID-19 – Charts: March 30-April 5, 2020

COVID-19 charts from March 30-April 5, 2020.

Below are charts from March 30 to April 5, 2020. See charts from the current week.


Maryland Cases by County

To keep these charts clean, I established a threshold of 50 confirmed cases to be separately listed in this chart. On 4/1/2020, Dorchester county reported its first confirmed case. On 4/2/2020, Allegany, the last to fall, reported its first case. On 4/5/2020 Harford crossed the 50 confirmed case threshold.

Maryland: Total COVID-19 Cases - By County
Maryland: Total COVID-19 Cases – By County
Continue reading “COVID-19 – Charts: March 30-April 5, 2020”

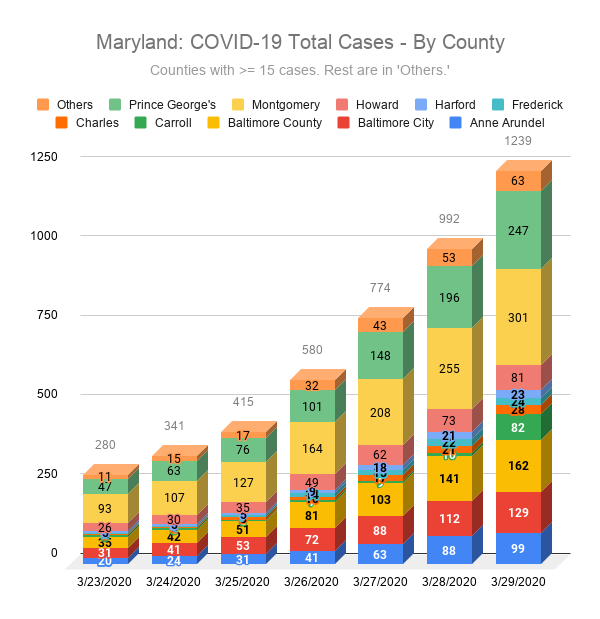
COVID-19 – Charts: March 23-29, 2020

COVID-19 charts from March 23-March 29, 2020.

Below are charts from March 23 to March 29, 2020. See charts from the current week.


Maryland: COVID-19 Total Cases - By County
Maryland: COVID-19 Total Cases – By County

On 3/27/2020, Charles, Frederick, Harford counties crossed the 15 case threshold, as did Carroll county on 3/29. As of 3/29/2020, Allegany and Dorchester remain the only counties in Maryland with no reported confirmed cases.

Continue reading “COVID-19 – Charts: March 23-29, 2020”

COVID-19 – Charts

COVID-19 charts that I cannot find anywhere else.

Update: I stopped updating these charts on 8/1/2020. Maryland and the DMV region cases have generally remained on a steady decline – thankfully.

I live in the DC area and want to know what the situation looks like locally. I’m not a fan of lists of numbers, or big red dots. They don’t tell me much. I want graphs showing changes over time. I want to see if things are trending better or worse.

Below are charts to help me ‘see’ what is happening. These are charts I cannot find anywhere else and compliment the other sources provided at the bottom of the post. The data is from credible sources, cited below.

Continue reading “COVID-19 – Charts”