Maine 2020 – Episode 2

The adventure continues. A bittersweet end.

The second two weeks were as fun as the first.

The kids still had camp in the morning. I was officially on vacation from work and my mornings were spent doing yard work. I allocated about 1 hour per day for weeding, trimming, and pruning. It was equal measures rewarding and exhausting. 

Continue reading “Maine 2020 – Episode 2”

COVID-19 – Charts: April 27-May 3, 2020

COVID-19 charts from April 27-May 3, 2020

Below are charts from April 27 to May 3, 2020. See charts from the current week.


Maryland Cases by County

To keep these charts clean, I established a threshold of 250 confirmed cases to be separately listed in this chart.

Maryland: Total COVID-19 Cases - By County
Maryland: Total COVID-19 Cases – By County
Continue reading “COVID-19 – Charts: April 27-May 3, 2020”

COVID-19 – Charts: April 20-26, 2020

COVID-19 charts from April 20-April 26, 2020

Below are charts from April 20 to April 26, 2020. See charts from the current week.


Maryland Cases by County

To keep these charts clean, I established a threshold of 250 confirmed cases to be separately listed in this chart.

Maryland: Total COVID-19 Cases - By County
Maryland: Total COVID-19 Cases – By County
Continue reading “COVID-19 – Charts: April 20-26, 2020”

COVID-19 – Charts: April 13-19, 2020

COVID-19 charts from April 13-April 19, 2020

Below are charts from April 13 to April 19, 2020. See charts from the current week.


Maryland Cases by County

To keep these charts clean, I established a threshold of 50 confirmed cases to be separately listed in this chart.

Maryland: Total COVID-19 Cases - By County
Maryland: Total COVID-19 Cases – By County
Continue reading “COVID-19 – Charts: April 13-19, 2020”

COVID-19 – Charts: March 30-April 5, 2020

COVID-19 charts from March 30-April 5, 2020.

Below are charts from March 30 to April 5, 2020. See charts from the current week.


Maryland Cases by County

To keep these charts clean, I established a threshold of 50 confirmed cases to be separately listed in this chart. On 4/1/2020, Dorchester county reported its first confirmed case. On 4/2/2020, Allegany, the last to fall, reported its first case. On 4/5/2020 Harford crossed the 50 confirmed case threshold.

Maryland: Total COVID-19 Cases - By County
Maryland: Total COVID-19 Cases – By County
Continue reading “COVID-19 – Charts: March 30-April 5, 2020”

COVID-19 – Charts: March 23-29, 2020

COVID-19 charts from March 23-March 29, 2020.

Below are charts from March 23 to March 29, 2020. See charts from the current week.


Maryland: COVID-19 Total Cases - By County
Maryland: COVID-19 Total Cases – By County

On 3/27/2020, Charles, Frederick, Harford counties crossed the 15 case threshold, as did Carroll county on 3/29. As of 3/29/2020, Allegany and Dorchester remain the only counties in Maryland with no reported confirmed cases.

Continue reading “COVID-19 – Charts: March 23-29, 2020”

COVID-19 – Charts

COVID-19 charts that I cannot find anywhere else.

Update: I stopped updating these charts on 8/1/2020. Maryland and the DMV region cases have generally remained on a steady decline – thankfully.

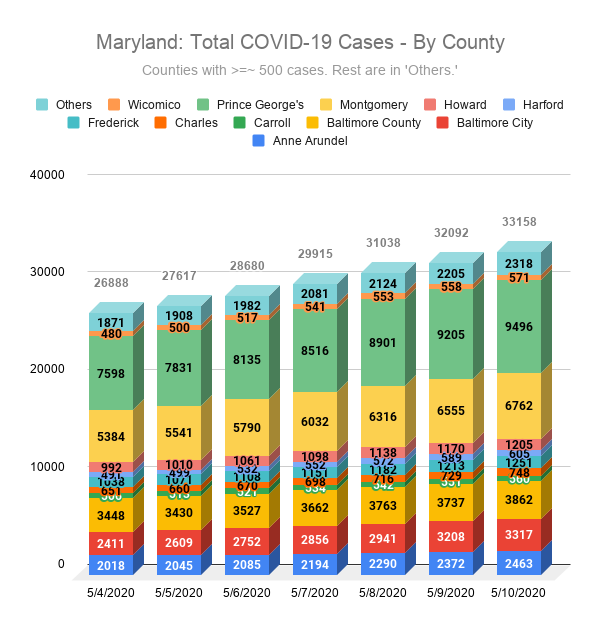
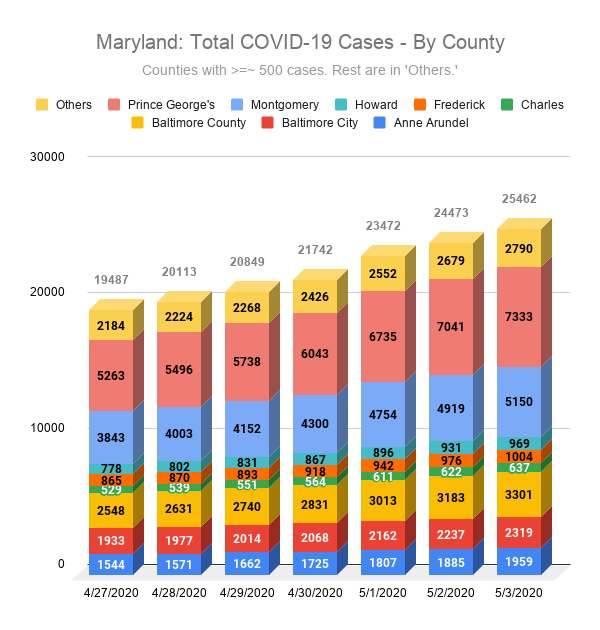
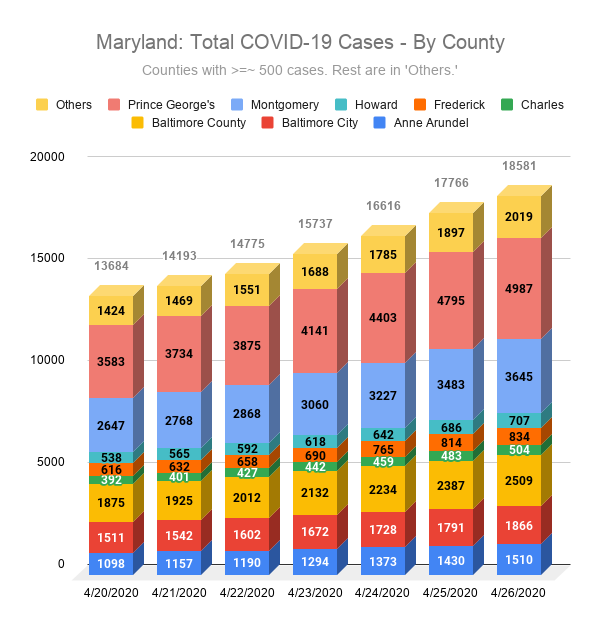
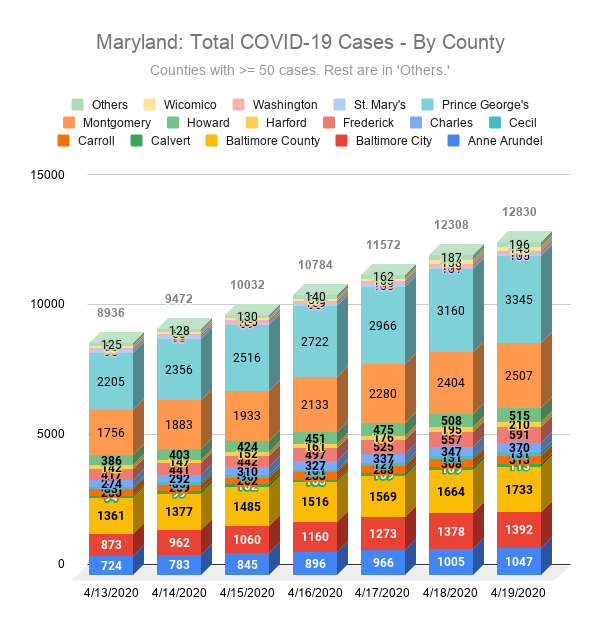
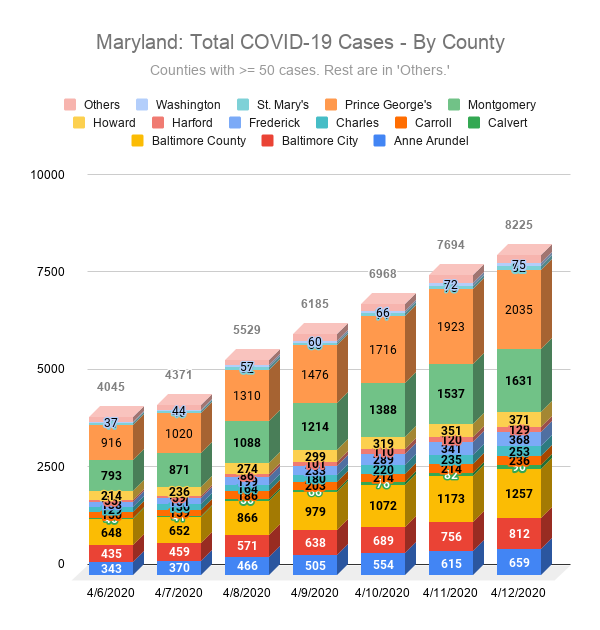
I live in the DC area and want to know what the situation looks like locally. I’m not a fan of lists of numbers, or big red dots. They don’t tell me much. I want graphs showing changes over time. I want to see if things are trending better or worse.

Below are charts to help me ‘see’ what is happening. These are charts I cannot find anywhere else and compliment the other sources provided at the bottom of the post. The data is from credible sources, cited below.

Continue reading “COVID-19 – Charts”