
Below are charts from April 13 to April 19, 2020. See charts from the current week.
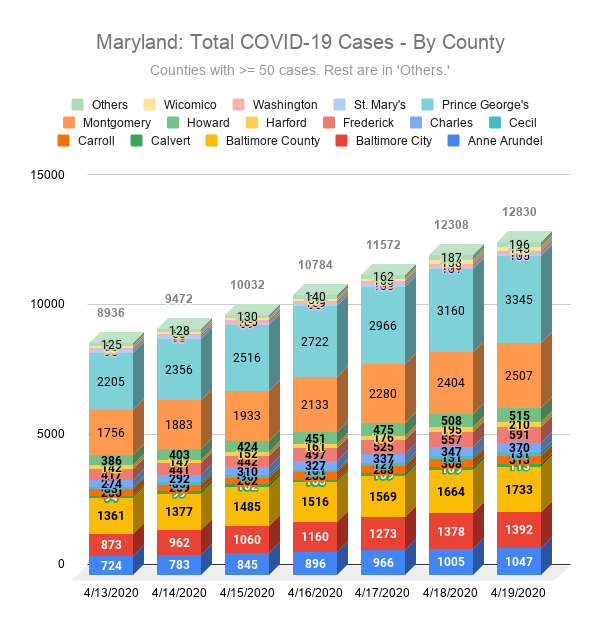
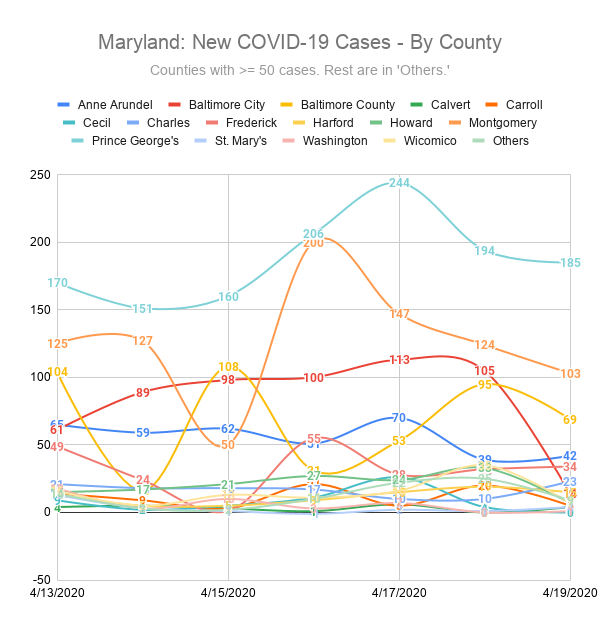
Maryland Cases by County
To keep these charts clean, I established a threshold of 50 confirmed cases to be separately listed in this chart.
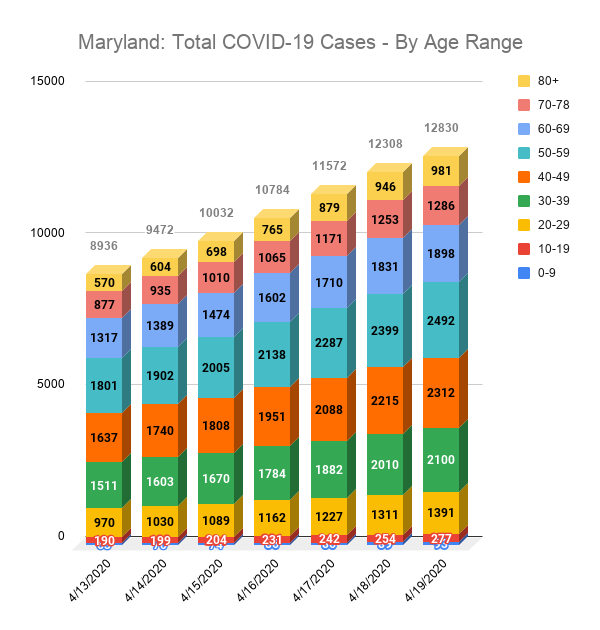
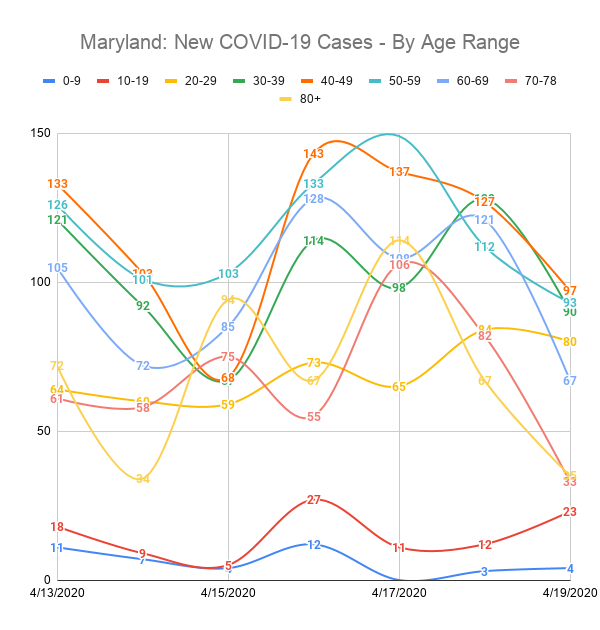
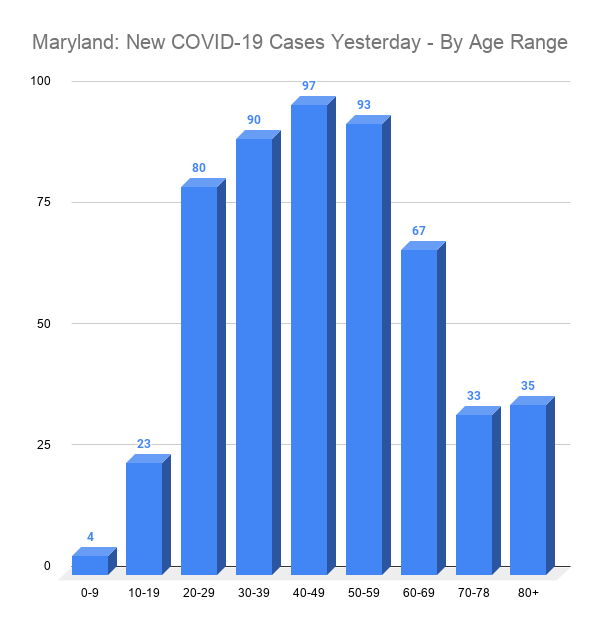
Maryland Cases by Age Range
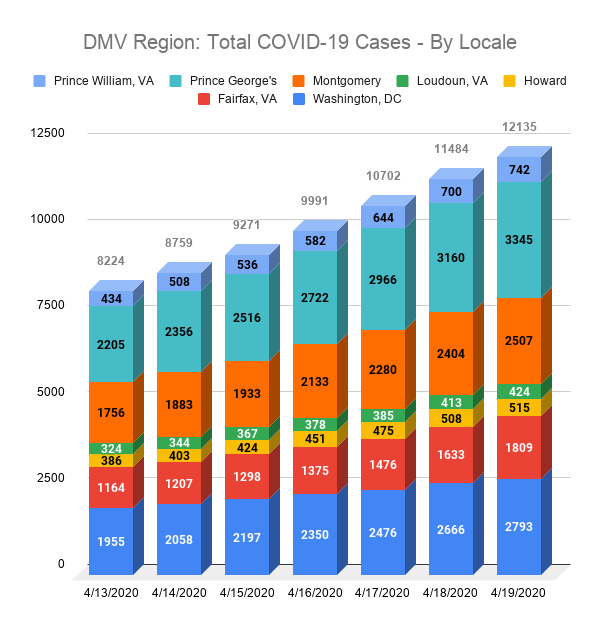
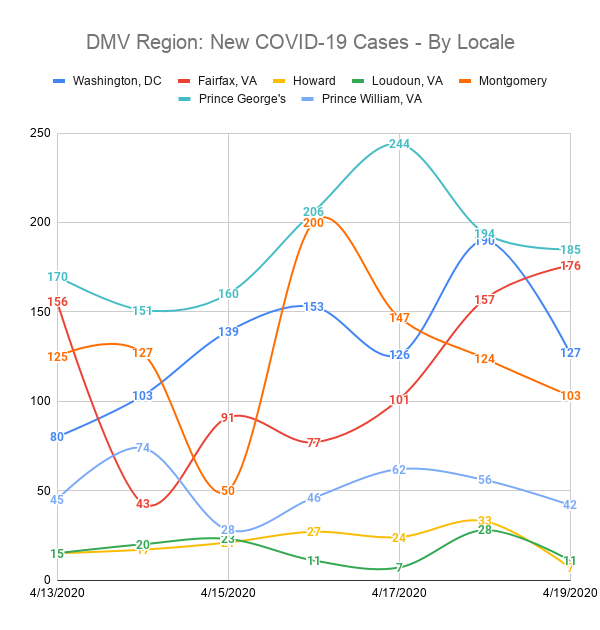
The DMV Region
These charts covers a portion of the Washington DC, Maryland, and Virginia region (the DMV). Specifically, it includes Washington DC and the Maryland and Virginia counties that are within a reasonable commuting radius of the city.
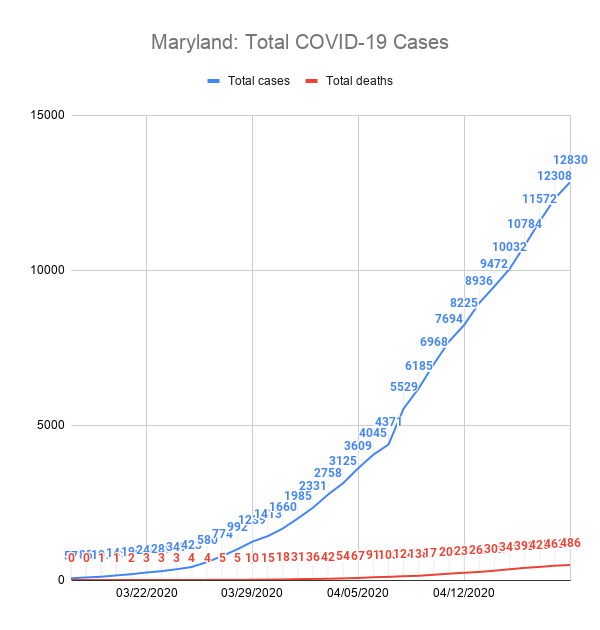
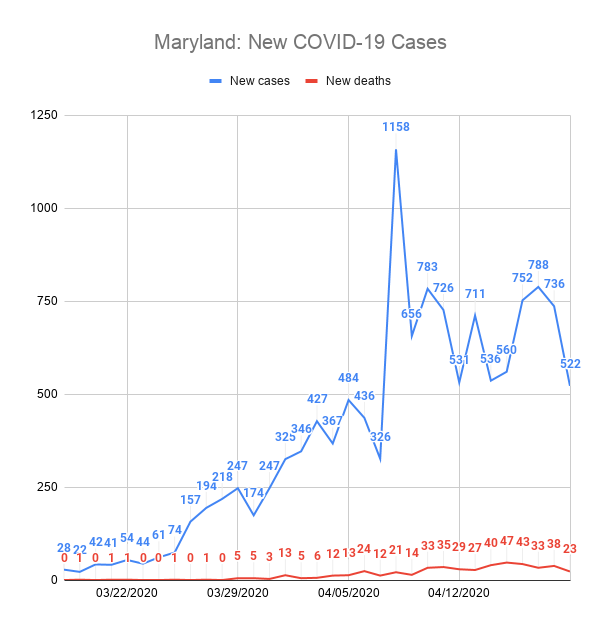
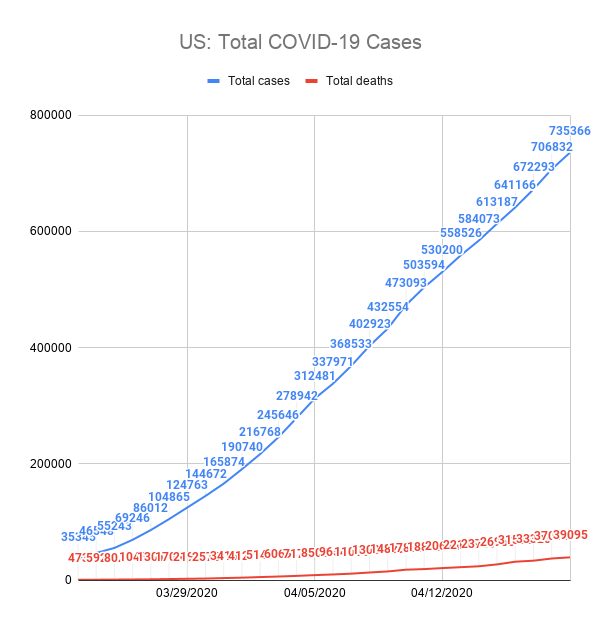
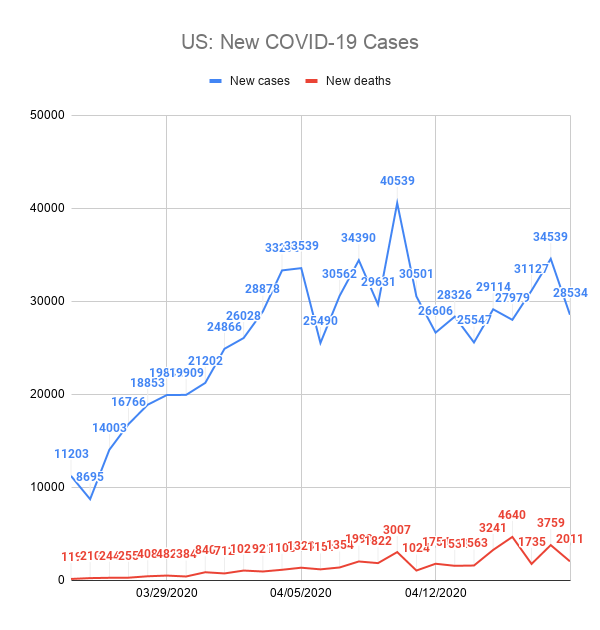
Maryland and the U.S. – How are we doing over time?
References and resources
Data sources for the charts above:
- Maryland Data: https://coronavirus.maryland.gov/
- Virginia Data: http://www.vdh.virginia.gov/coronavirus/
- DC Data: https://coronavirus.dc.gov/page/coronavirus-data
- US Data: https://coronavirus.jhu.edu/map.html
- Coronavirus COVID-19 Global Cases by the Center for Systems Science and Engineering (CSSE) at Johns Hopkins University(JHU)