Below are charts from May 4 to May 10, 2020. See charts from the current week.
Maryland Cases by County
To keep these charts clean, I established a threshold of 250 confirmed cases to be separately listed in this chart.
About life and adventure

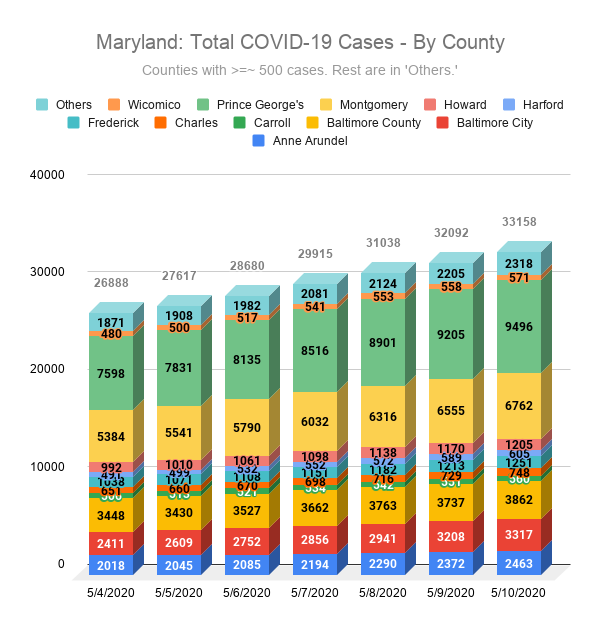
COVID-19 charts from May 4-May 10, 2020
Below are charts from May 4 to May 10, 2020. See charts from the current week.
To keep these charts clean, I established a threshold of 250 confirmed cases to be separately listed in this chart.
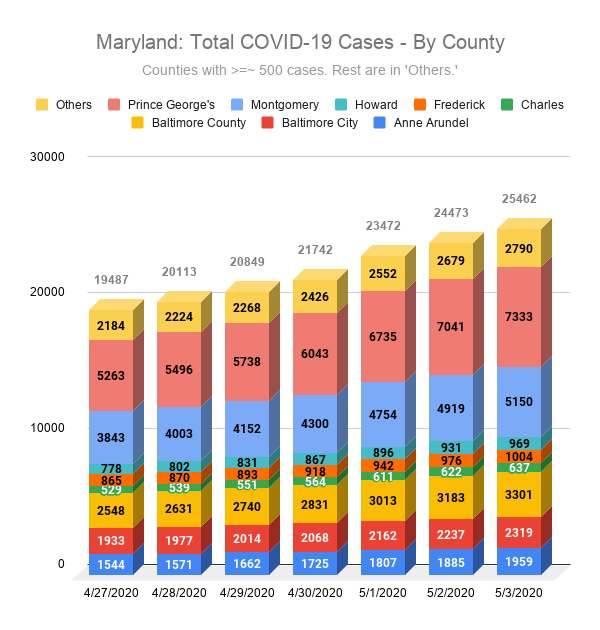
COVID-19 charts from April 27-May 3, 2020
Below are charts from April 27 to May 3, 2020. See charts from the current week.
To keep these charts clean, I established a threshold of 250 confirmed cases to be separately listed in this chart.