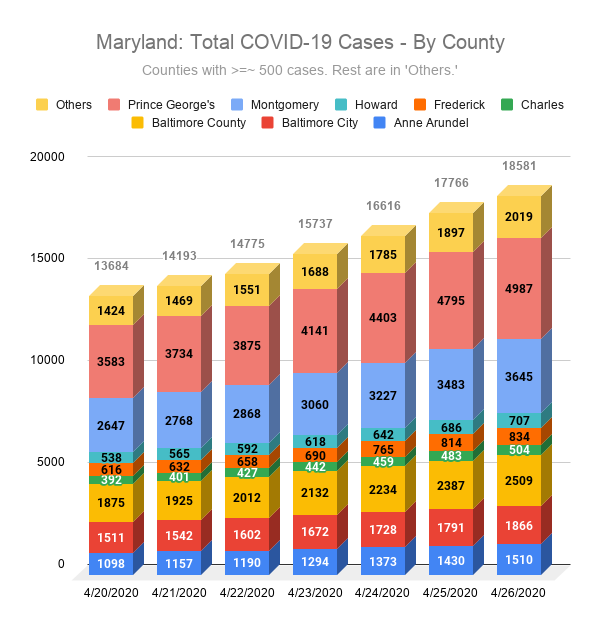
Below are charts from April 20 to April 26, 2020. See charts from the current week.
Maryland Cases by County
To keep these charts clean, I established a threshold of 250 confirmed cases to be separately listed in this chart.
About life and adventure

COVID-19 charts from April 20-April 26, 2020
Below are charts from April 20 to April 26, 2020. See charts from the current week.
To keep these charts clean, I established a threshold of 250 confirmed cases to be separately listed in this chart.
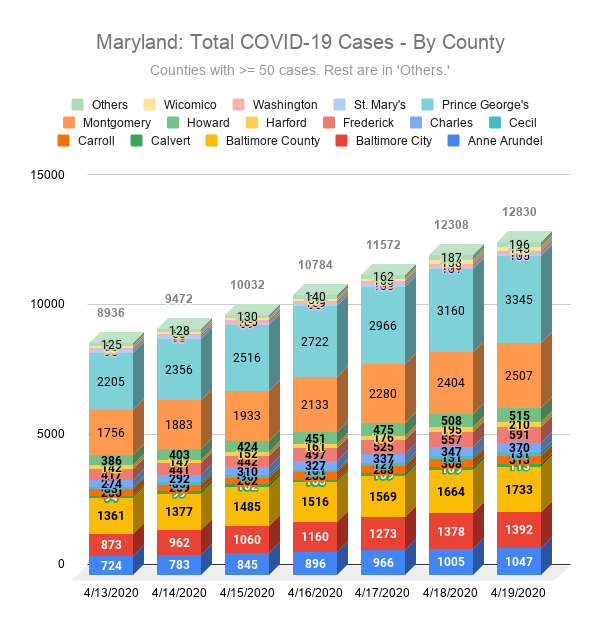
COVID-19 charts from April 13-April 19, 2020
Below are charts from April 13 to April 19, 2020. See charts from the current week.
To keep these charts clean, I established a threshold of 50 confirmed cases to be separately listed in this chart.
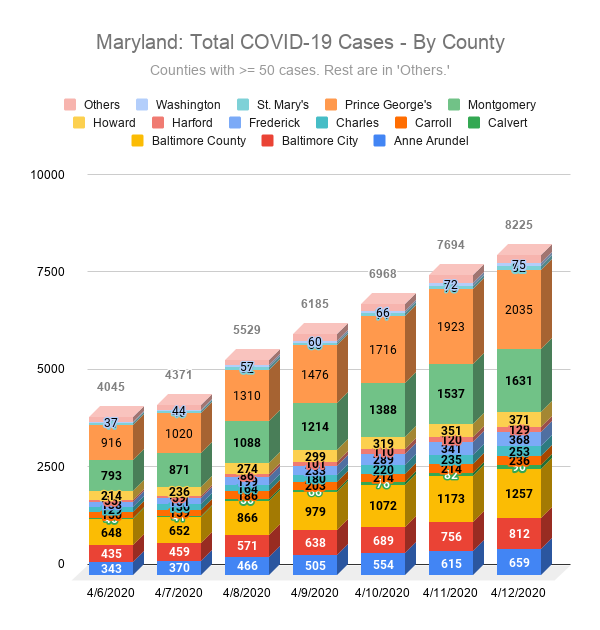
COVID-19 charts from April 6-April 12, 2020.
Below are charts from April 6 to April 12, 2020. See charts from the current week.
To keep these charts clean, I established a threshold of 50 confirmed cases to be separately listed in this chart.
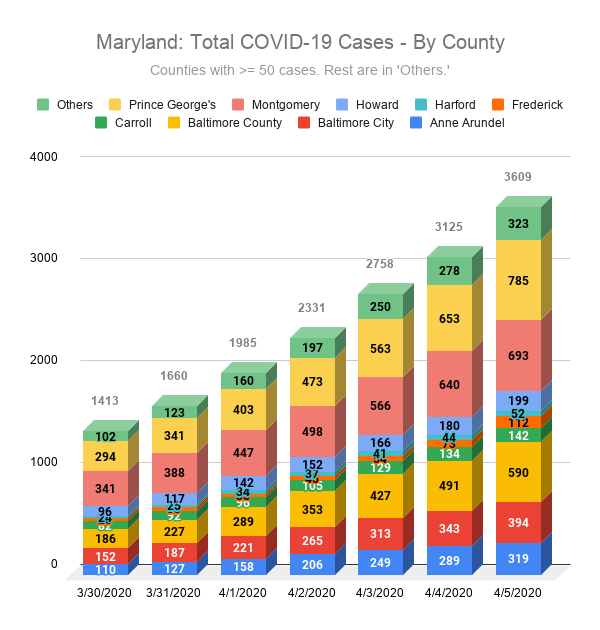
COVID-19 charts from March 30-April 5, 2020.
Below are charts from March 30 to April 5, 2020. See charts from the current week.
To keep these charts clean, I established a threshold of 50 confirmed cases to be separately listed in this chart. On 4/1/2020, Dorchester county reported its first confirmed case. On 4/2/2020, Allegany, the last to fall, reported its first case. On 4/5/2020 Harford crossed the 50 confirmed case threshold.