
Below are charts from March 23 to March 29, 2020. See charts from the current week.
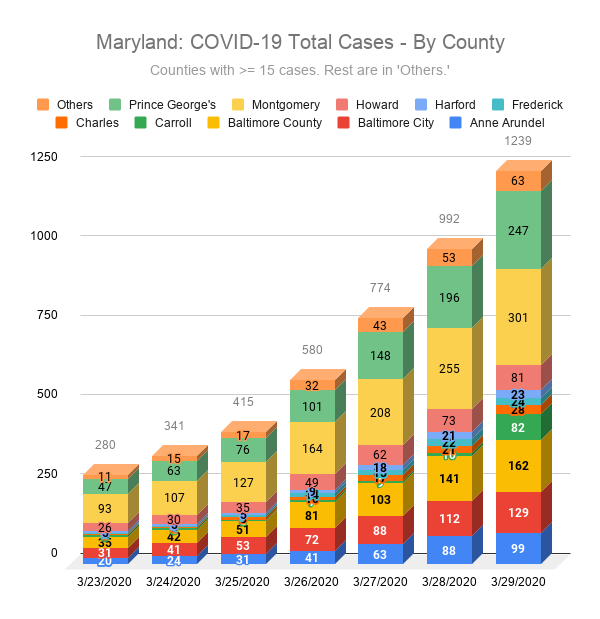
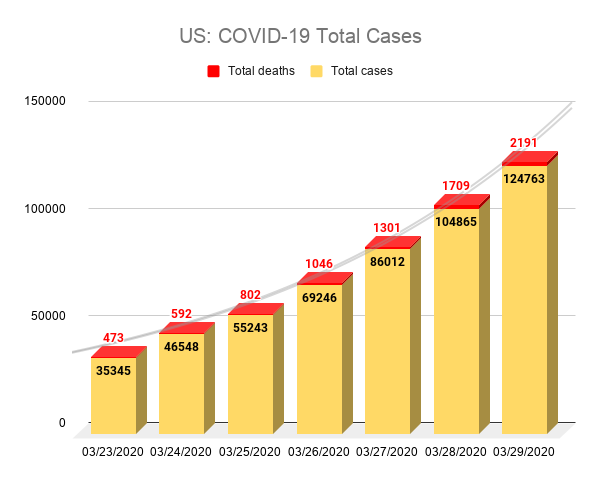
On 3/27/2020, Charles, Frederick, Harford counties crossed the 15 case threshold, as did Carroll county on 3/29. As of 3/29/2020, Allegany and Dorchester remain the only counties in Maryland with no reported confirmed cases.
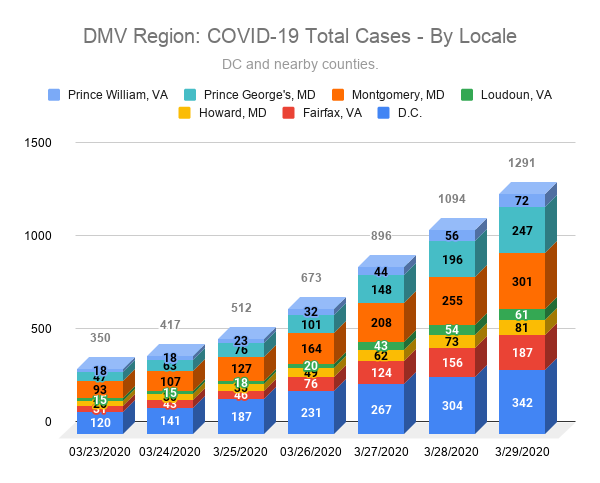
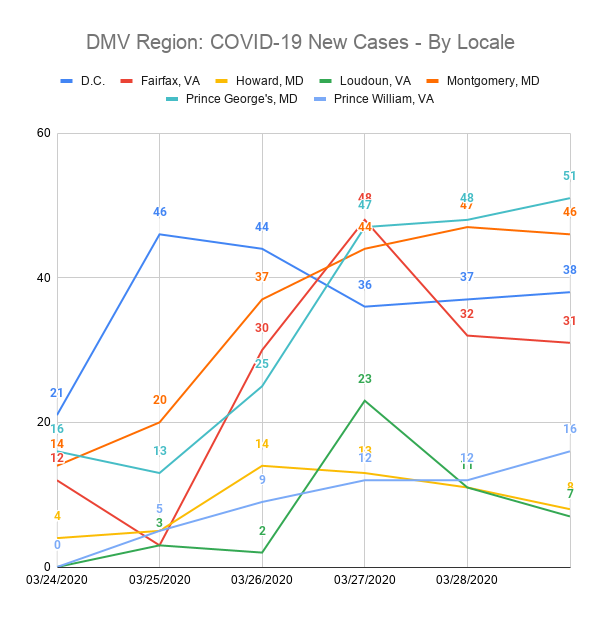
The above chart covers the Washington DC, Maryland, and Virginia region (the DMV). Specifically, it includes Washington DC and the Maryland and Virginia counties that are within a reasonable commuting radius of the city.
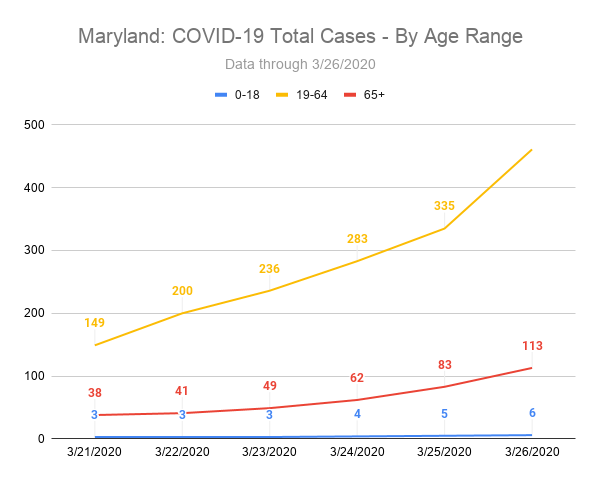
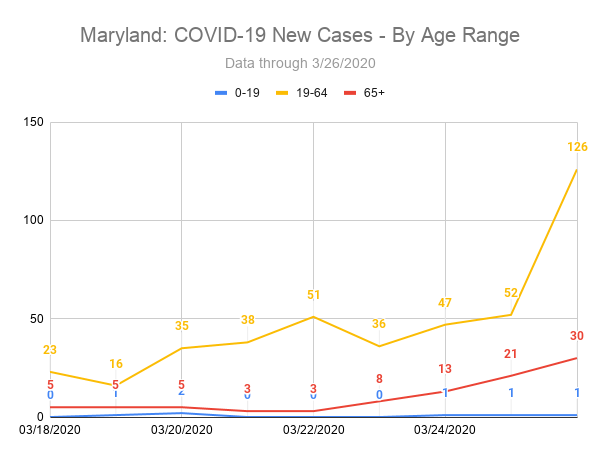
Maryland changed the way they provided case data by age range on 3/27. I’ll post a chart reflecting new data beginning Monday, 3/30/2020.
Maryland changed the way they provided case data by age range on 3/27. I’ll post a chart reflecting new data beginning Monday, 3/30/2020.
Data sources for the charts above:
- Maryland Data: https://coronavirus.maryland.gov/
- Virginia Data: http://www.vdh.virginia.gov/coronavirus/
- US and DC Data: https://coronavirus.jhu.edu/map.html
- Coronavirus COVID-19 Global Cases by the Center for Systems Science and Engineering (CSSE) at Johns Hopkins University(JHU)